Basketball
Currently I serve as manager of research for the Philadelphia 76ers, working on problems like data engineering and predictive modeling.
Real-time optical tracking data from STATS SportVu:
The first rebound of the 2014-15 NBA regular season.
Data Mining
Before joining the 76ers, I started a Github repo of scripts to scrape and analyze basketball data, including box scores, play-by-play, shot charts. and optical tracking. Data collection scripts use Python to scrape the web, while analysis scripts are written in Python, Matlab, and R and implement a variety of machine learning techniques. For example, here is a Jupyter notebook to generate the SportVu movie above. For links to the data, tutorials, etc. see the Github repo.
Statistical Modeling
Below is a selection of modeling work I did prior to joining the 76ers. It leverages some of the modeling techniques we used in analyzing human seizures.
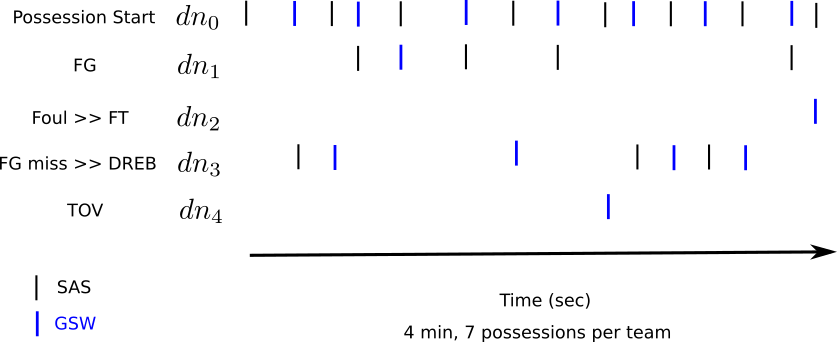
The point process generalized linear model (PP GLM) is a powerful and flexible way of modeling count data (e.g. lightning strikes, earthquakes, and neuronal spikes). It is also a natural choice for modeling discrete processes in basketball like shots, rebounds, and turnovers. We consider two models of shooting below.
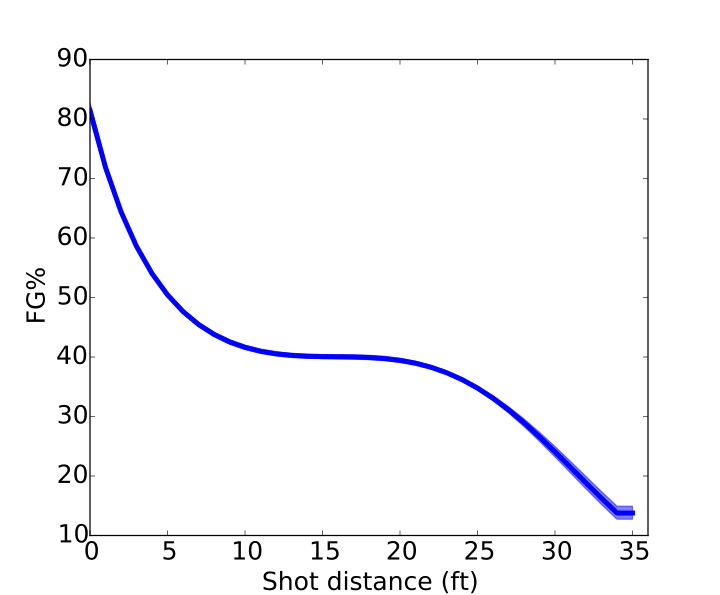
We start with a model of shooting efficiency, estimating how shot success depends on distance from the basket. The model is trained on shots from the 2014-15 and 2015-16 regular seasons (2,460 games). Thin shaded areas show 95% confidence intervals.
The model estimates show several interesting features. First, short-distance shots are 80% accurrate at the basket (0 feet) but quickly fall to 60% accurate or worse at 3+ feet. Three-point shots experience a similar drop from 40% accurate near the line (22-24 feet) to 25% accurate at 27 feet. Meanwhile, the accuracy of a mid-range 2-pointer (5-20 feet) hovers in a relatively stable range of 40-45%. This may reflect an athletic component of shooting skill, or it may be confounded by additional factors such as defensive pressure. In other words, a player's distance may affect whether a shot is contested or not, which in turn affects FG%.
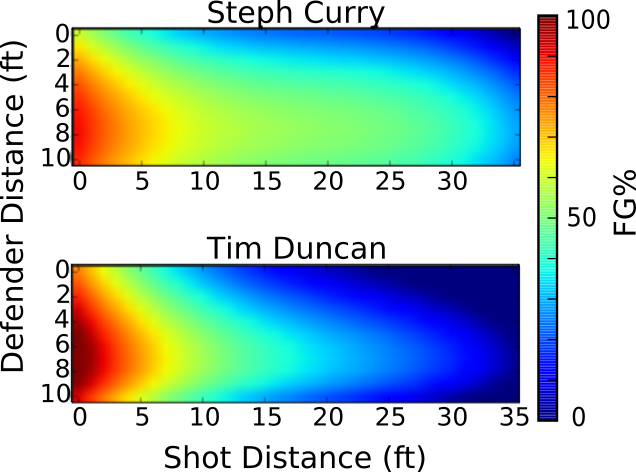
Next, we can account for defensive pressure by extending the model with another variable: defender distance. Two examples appear below, now as heat maps with color representing shot accuracy. From the heat maps we find that Steph Curry is not as effective shooting near the rim as the 6'11 Tim Duncan. However Curry's efficiency remains steady even at long range (25+ feet), while Duncan's falls off at 10-15 feet from the basket. Most critically, the y-axis on the heat maps now compares how well each player shoots contested (y=0) versus uncontested (y=10). Steph Curry is nearly 50% accurate from 3-point range when the defender is 4+ feet away (light green) but when the defender is 1-2 feet away, his accuracy drops down around 25% (light blue). Duncan's mid-range shot chart -- mostly blue -- shows that his accuracy is poor even with a defender 4+ feet away. Defensive pressure has relatively little value against Duncan, but lots against Curry.
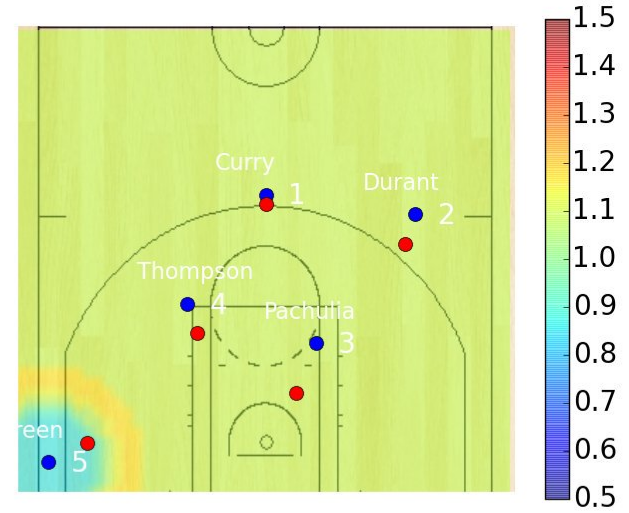
Player efficiency models can be used to evaluate defensive tradeoffs. For example, suppose the the Golden State Warriors (blue circles) set on offense as shown guarded by five defenders (red circles). Based on the Warriors' five shooting efficiencies, we can rank all five shots by expected point value (EPV). Implicitly, the Warriors on offense want to maximize EPV, and the defense wants to minimize it by forcing the least dangerous shot it can. Here the most dangerous open shot is a Steph Curry 3-pointer. The least dangerous open shot is a Draymond Green corner 3.
Green's defender has the best opportunity to help because his matchup has the least threatening shot. But should he? When is it worth it? In the figure, if all five defenders contest from the spots shown -- including Green's -- the Warriors' maximum EPV is a low 0.75. By leaving to help elsewhere, Green's accuracy climbs from 15% to 35% and the expected points scored rises over 1. Colored rings around Green's defender illustrate exactly where this tradeoff occurs on the court. From this type of estimate, it becomes possible to identify when/where help defense should be extended as new shots develop, such as Pachulia slashing to the basket.